Assignment for Class 9
Please complete before the next class.
Make sure that you’ve completed all previous HW first.
Show Notes
In class, we looked at this histogram.
# load packages
library(tidyverse)

# load ideology scores data set
nom <- read_csv("https://pos3713.github.io/data/nominate.csv")

# keep only legislators from the 115th congress
nom115 <- filter(nom, congress == 115)

# plot
ggplot(nom115, aes(x = ideology, fill = party)) +
  geom_histogram() +
  scale_fill_manual(values = c("Democrat" = "blue", "Republican" = "red"))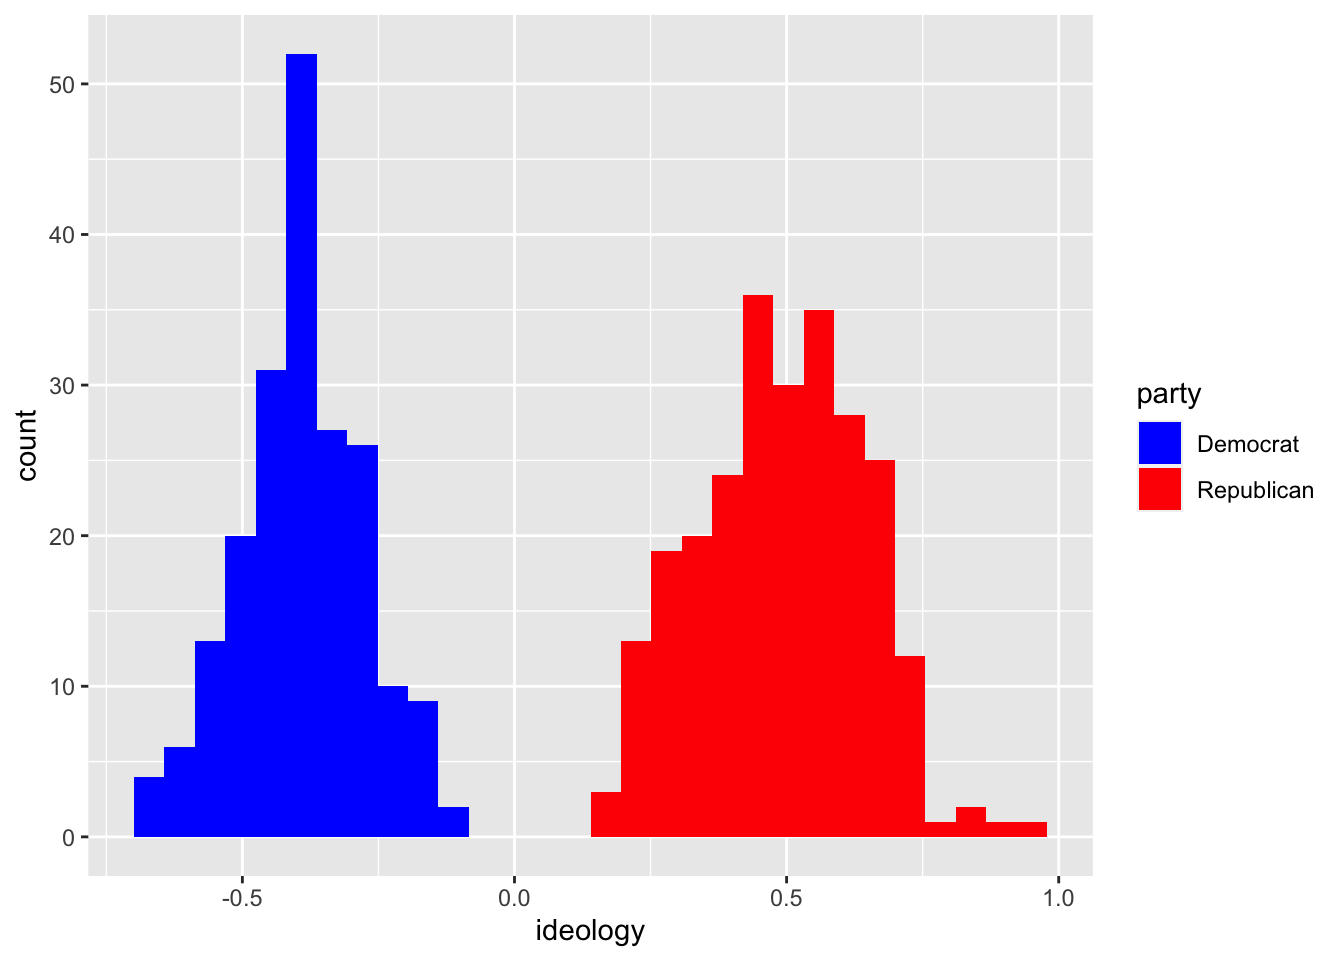
FPP
Read ch. 4 of FPP (the textbook; see the syllabus) and do the assigned review exercises here.
For a given list of numbers, make sure that you can calculate the average and SD. If you’re signed in to your Google account, you can create problems and check your work by creating a copy of this Google Sheet.
Computing Assignment 1
…has been moved back a couple of class period. It’s now due a week later than originally planned. I’ll mention it in the appropriate HW.

Carlisle Rainey